Reporting Menu
Brand Advocate Program
Reporting Menu
Reporting Menu
Brand Advocates run, analyze and provide a variety of reports specific to the participating brand. With this, Brand Advocates measure data health (attributes filled, images, videos, etc.) against performance expectations, report out impact of actions, and identify future content optimization or experience opportunities.
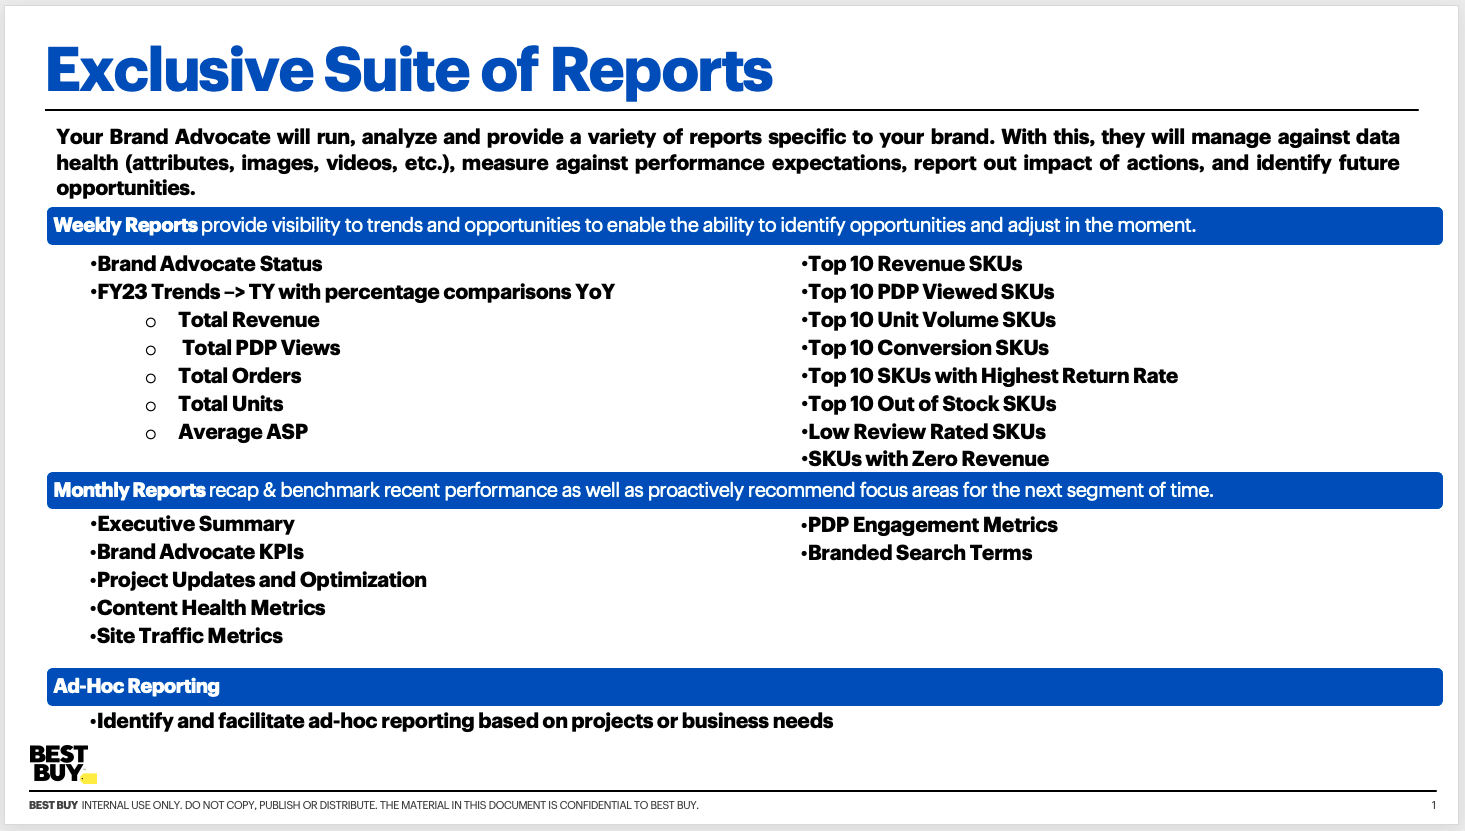
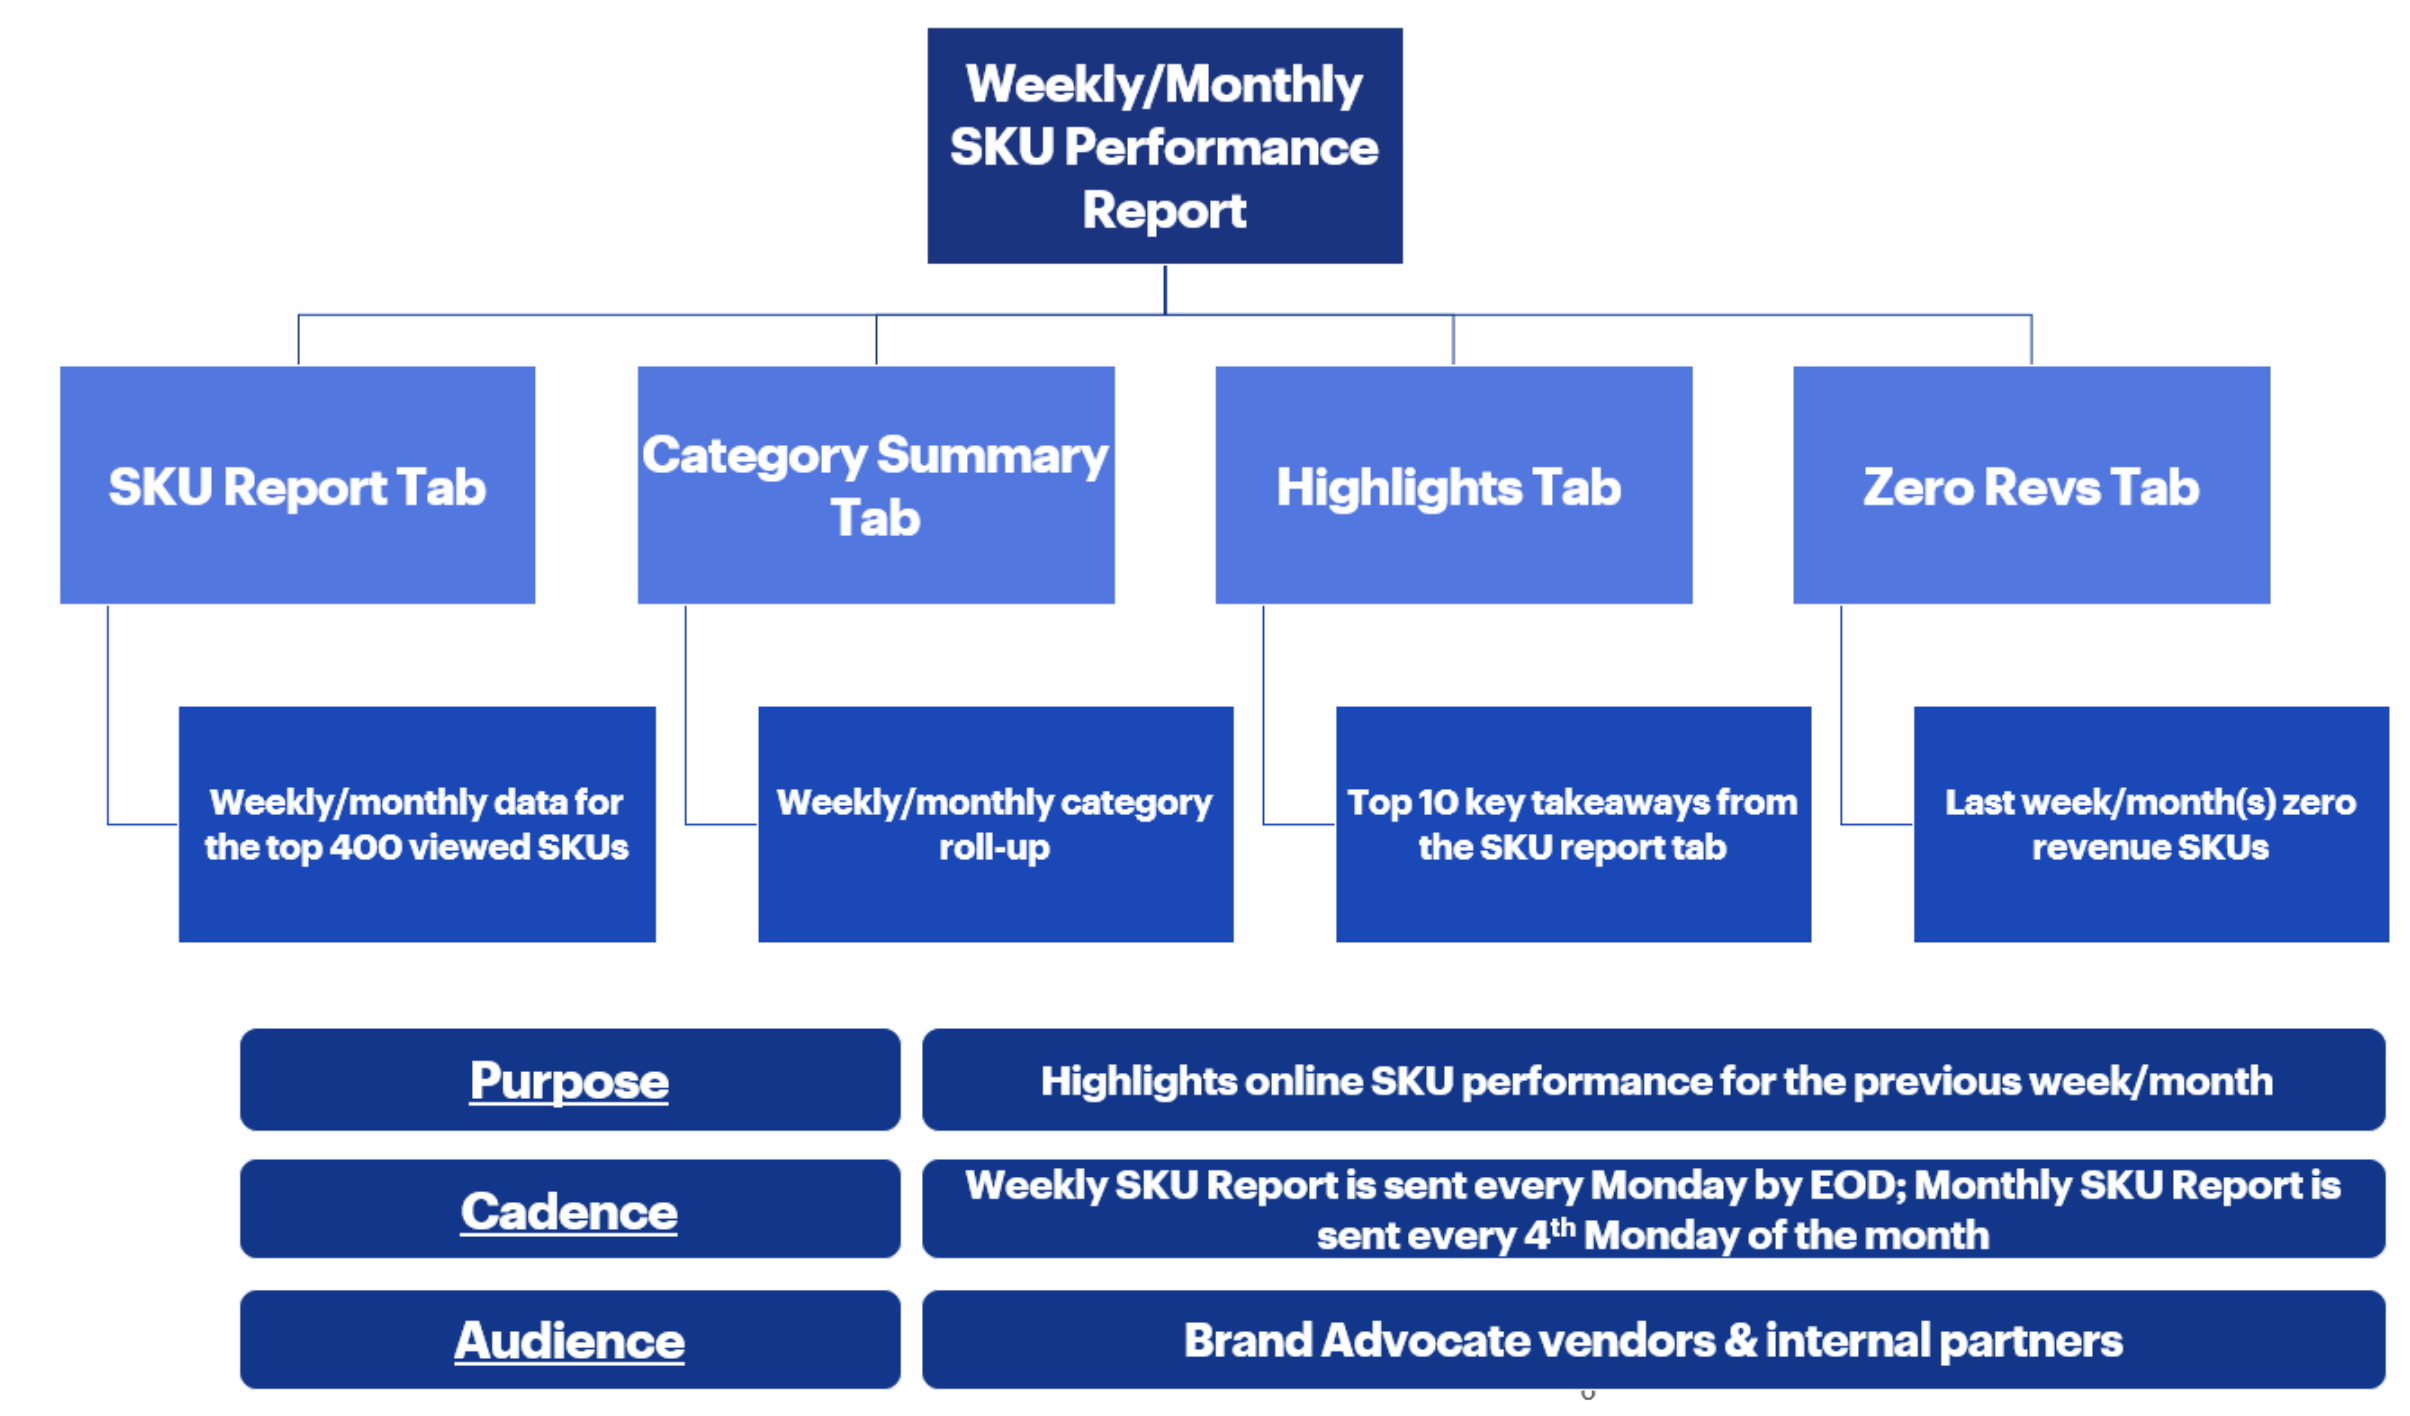
SKU Performance Report [Weekly & Monthly Reporting]
What's Included?

Guidance
- Prioritize projects that will improve digital content health by metric performance
- Ex. Backfill projects for one Category/Class/SKU should be prioritized over another based on the total revenue of that Category/Class/SKU
- Indicator for follow-up with other cross-functional partners to address outlier performance
- Conversion % / Returns % / Out of Stock % is higher than typical, could be a check-in opportunity with that partner team (e.g. Reverse Supply Chain, Demand Planning, etc)
- Highlight opportunities for content optimization when looking at SKUs with high PDP views and low conversion rate
- Ex. Why is this product being viewed 30k times in one week but the conversion rate is only 0.1%
Metric Definitions
| Metric Name | Metric Definitions |
|---|---|
| AOV (Average Order Value) | Revenue / Orders. AOV is only calculated within a single Class so AOVs may be very close to ASPs. |
| ASP (Average Selling Price) | Revenue / Units |
| Button State Out of Stock Rate | % of PDP views with the Add to Cart button saying "Sold Out" or "Unavailable" vs # of Total PDP views |
| Cancel Rate | Canceled $ / Marketed Demand $ |
| Cart Additions | # of times the SKU was added to cart |
| Conversion Rate | Order / Visits. The % of visits that converted into an order. |
| ISPU (In Store Pick Up) Rate | # Marketed Demand Units picked up in-store / Marketed Demand Units |
| LOB (Line of Business) | Often used to indicate Core vs SDF product |
| Number of Reviews | Count of product reviews for SKU when present |
| Orders | # of orders containing at least one unit of the SKU. Completed transaction. Note: One order can contain multiple units. |
| PDP Views | # of views for a Product Detail Page (PDP) |
| Return Rate | Units Returned / Units Fulfilled |
| Revenue | Total Marketed Demand dollar amount sold before returns and cancelations |
| Review Rating | Average consumer rating when present |
| Rollup | Brands that have rollups, collecting either multiple Classes, or only specific Subclasses within a Class. |
| SDD (Site Display Date) | Date live on BestBuy.com |
| Units | # of units that were fulfilled |
| Visits | # of visits where SKU fired at least once. Can occur viewing a PDP, adding to cart, saving for later, compare within a 30-minute session |
Questions? Visit our FAQ page.
Brand Advocate KPIs [Monthly Reporting]
What's Included?

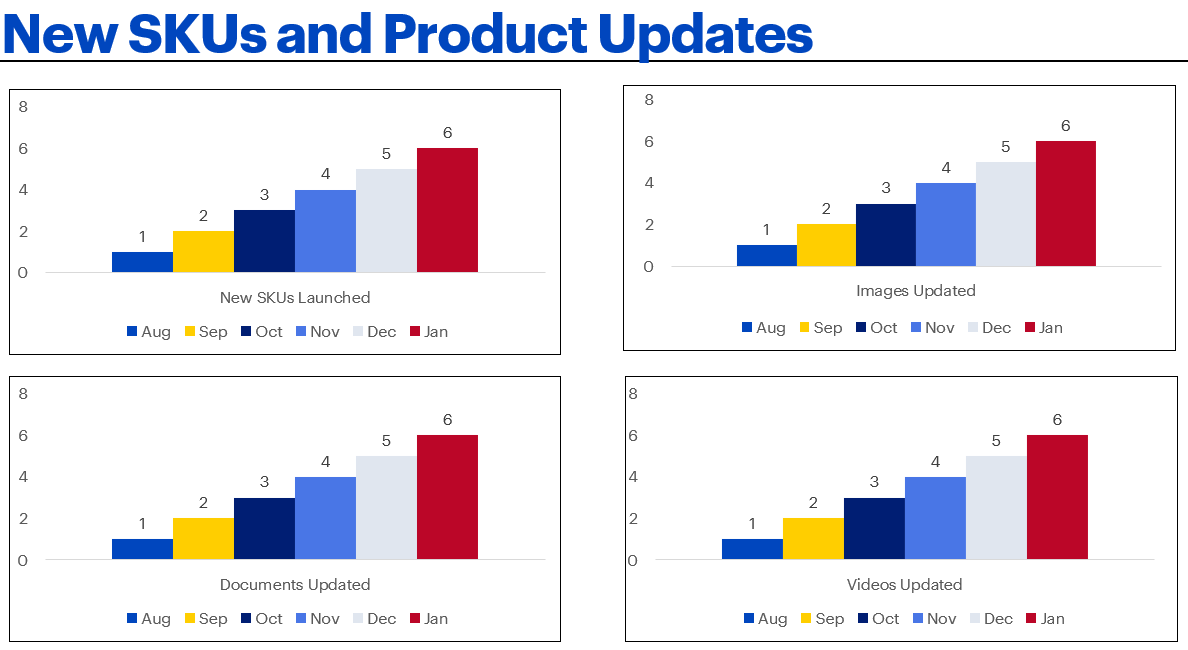
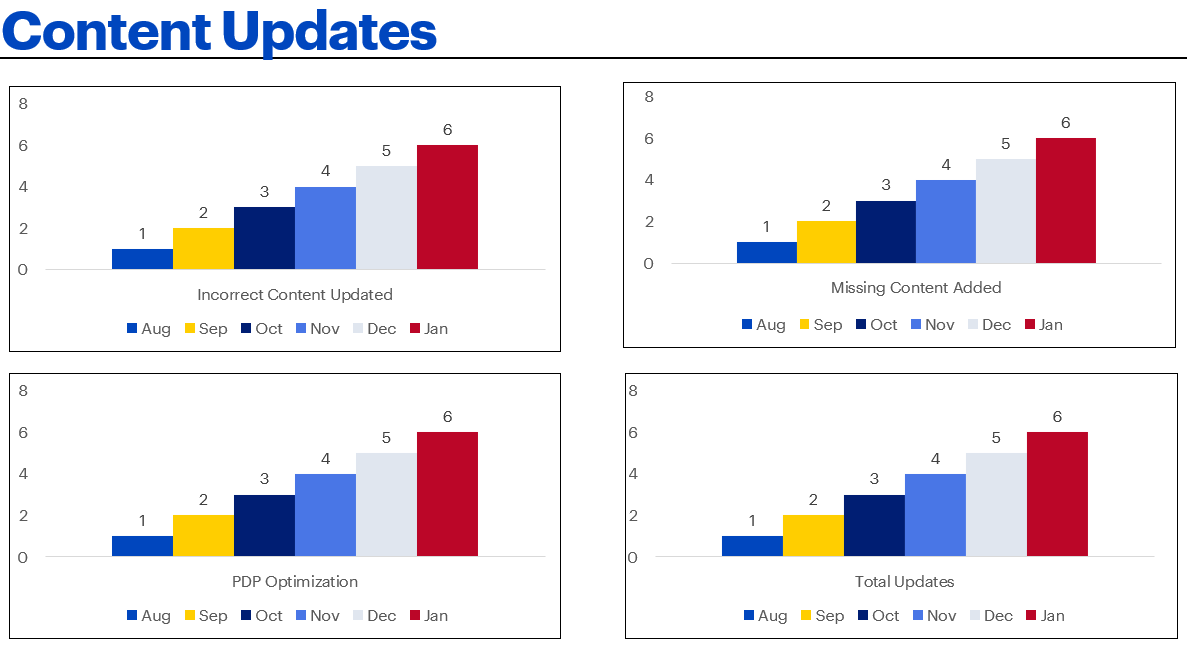
Guidance
- Use in partnership with content health to determine future project work
- Ex. There haven't been any videos added to the PDP and brand is down vs. category, next month BA/vendor will collaborate to add more videos to the PDP and increase their video coverage % as well as their video count.
- Use in partnership with content health to measure project impact
- Ex. BA/vendor collaborated on a video project and added 100 videos to the PDPs, thus increasing their video coverage % and video count.
Metric Definitions
| Metric Name | Metric Definitions |
|---|---|
| New SKUs Launched | Brand Advocate supported SKUs that have reached their Site Display Date (SDD) during the defined month |
| Images Updated | Number of images added, removed, or modified on a Product Detail Page (PDP) post-SDD |
| Documents Updated | Number of documents added, removed, or modified on a PDP post-SDD |
| Videos Updated | Number of videos added, removed, or modified on a PDP post-SDD |
| Incorrect Attributes Updated |
Number of updates to inaccurate attributes on a PDP, post-SDD. Common inaccuracies include:
|
| Missing Attributes Added |
Number of updates performed to populate previously blank required or optional attributes, post-SDD. Common reasons for updates include:
|
| Attributes Optimized |
Number of updates to attributes, post-SDD, to drive improvements to the customer experience and product performance. Examples include:
|
| Total Updates | Total of all monthly KPI updates |
Questions? Visit our FAQ page.
Content Health Metrics [Monthly Reporting]
What's Included?

Guidance
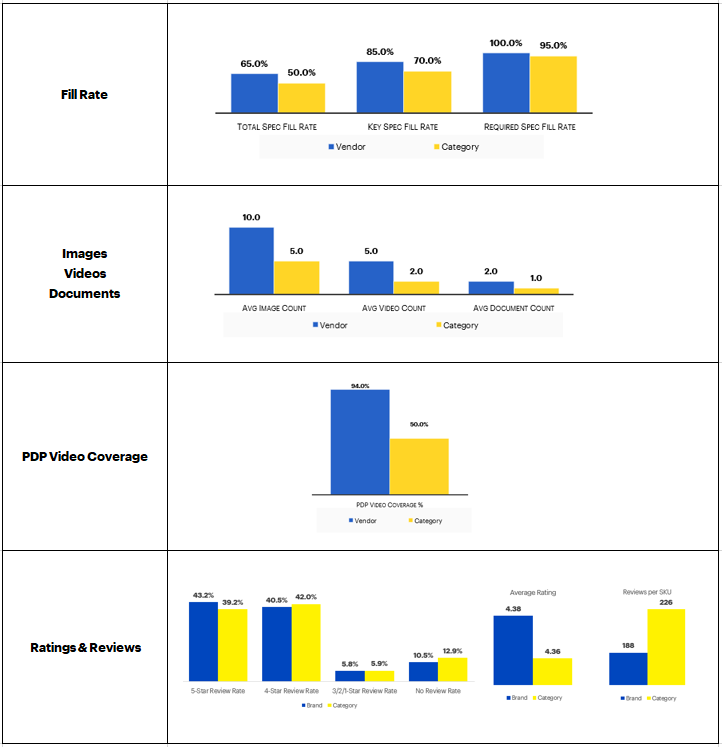
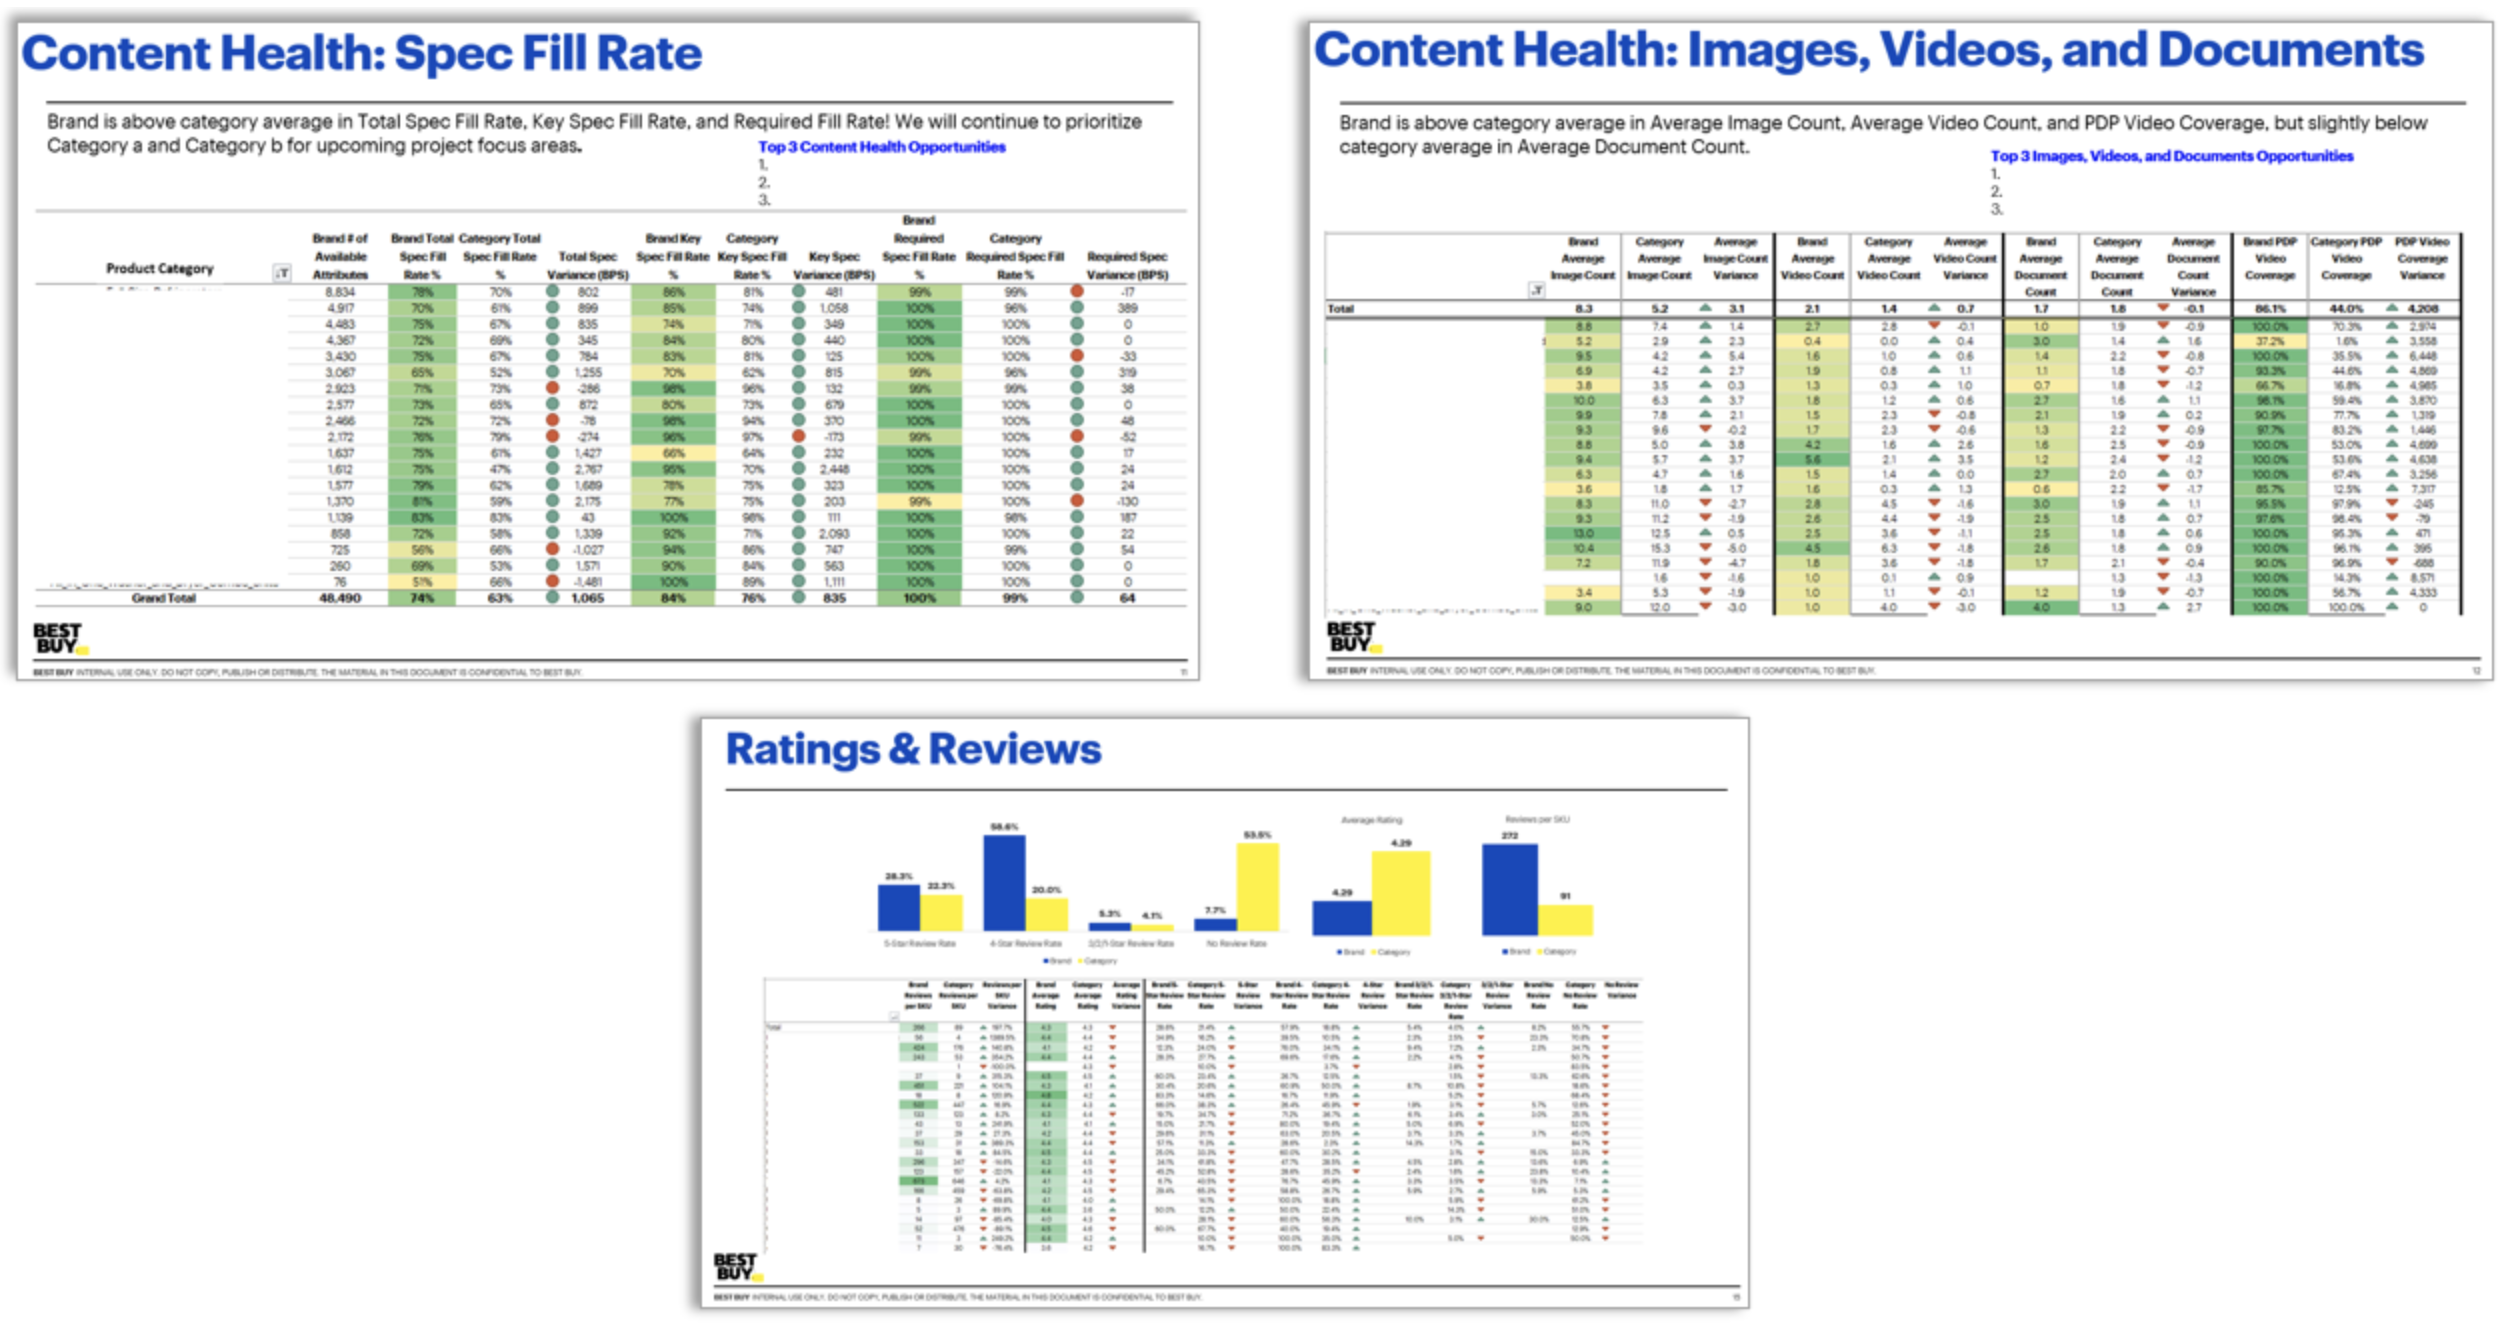
- Identifies gaps in digital content health by content type and Class to help prioritize project work
- Ex. If one particular Class is suffering in Conversion, Browse, or Search traffic, you can target Backfill projects to improve Image count, frequently engaged w/ features, and copy to boost SEO value
- Audit required and key spec fill rate for opportunities
- Ex. Initiate a Backfill project if there is an opportunity to fill required & key specs to improve the overall customer experience
- Highlights low-rated review categories to strategically target opportunity for improvement
- Ex. Strategic Categories that are scoring below category avg review rating will convert better if vendor engages with TIN, Review accelerator, Expert Review, or vendor-initiated audits.
- Provides a content health comparison vs. category to help prioritize project work
- Ex. Identify which specific Classes or Categories need to have Backfill projects initiated based on fill rate vs Category avg to bring them above the bar.
Metric Definitions
| Metric Name | Metric Definitions |
|---|---|
| Average Document Count Variance | Comparison of Brand versus Category average document count |
| Average Image Count Variance | Comparison of Brand versus Category average image count |
| Average Rating Variance | Comparison of Brand versus Category average star rating |
| Average Video Count Variance | Comparison of Brand versus Category average video count |
| Key Spec Variance (BPS) | Comparison of Brand versus Category key spec percentage, expressed in bps |
| No Review Variance | Comparison of Brand versus Category in no review ratings |
| PDP Video Coverage Variance | Comparison of Brand versus Category PDP video coverage |
| Required Spec Variance (BPS) | Comparison of Brand versus Category required spec percentage, expressed in bps |
| Reviews per SKU Variance | Comparison of Brand versus Category in reviews per SKU |
| Total Spec Variance (BPS) | Comparison of Brand versus Category total spec percentage, expressed in bps |
| 3/2/1-Star Review Variance | Comparison of Brand versus Category in 3/2/1 star ratings |
| 4-Star Review Variance | Comparison of Brand versus Category in 4-star ratings |
| 5-Star Review Variance | Comparison of Brand versus Category in 5-star ratings |
| Brand # of Available Attributes | Number of attributes multiplied by the number of SKUs for the Brand |
| Brand Required Spec Fill Rate % | Attribute is required for SKU to go live on BBY.com. Should be 100%. |
| Brand Total Spec Fill Rate % | % of Total Specifications populated by Brand |
| Category Key Spec Fill Rate % | % of Key Specifications populated. Key Specs are determined by the Category team. |
| Category Required Spec Fill Rate % | Attribute is required for SKU to go live on BBY.com. Should be 100%. |
| Category Total Spec Fill Rate % | % of Total Specifications populated by category |
| Brand Reviews per SKU | Average number of reviews per active (on the website) SKU, by Brand |
| Brand 3/2/1-Star Review Rate | Percentage of Brand with a 3/2/1-star rating |
| Brand 4-Star Review Rate | Percentage of Brand with a 4-star rating |
| Brand 5-Star Review Rate | Percentage of Brand with a 5-star rating |
| Brand No Review Rate | Percentage of Brand with no review rating |
| Brand Average Document Count | Average document count across the Brand |
| Brand Average Image Count | Average image count across the Brand |
| Brand Average Rating | Average star rating across the Brand |
| Brand Average Video Count | Average video count across the Brand |
| Brand Key Spec Fill Rate % | # of key spec attributes fill in compared to the total # of key spec attributes |
| Brand PDP Video Coverage | Average PDP video coverage across the Brand |
| Category 3/2/1-Star Review Rate | % of SKUs that have an average rating that rounds to/between… 3 – 1 |
| Category 4-Star Review Rate | % of SKUs that have an average rating that rounds to 4 |
| Category 5-Star Review Rate | % of SKUs that have an average rating that rounds to 5 |
| Category Average Document Count | Average document count across a category |
| Category Average Image Count | Average image count across a category |
| Category Average Rating | Average star rating across a category |
| Category Average Video Count | Average video count across a category |
| Category No Review Rate | % of active (on the website) SKUs with no reviews |
| Category PDP Video Coverage | Average PDP video coverage across a category |
| Category Reviews per SKU | Average number of reviews per active (on the website) SKU |
Questions? Visit our FAQ page.
Site Traffic Metrics [Monthly Reporting]
What's Included?
Guidance
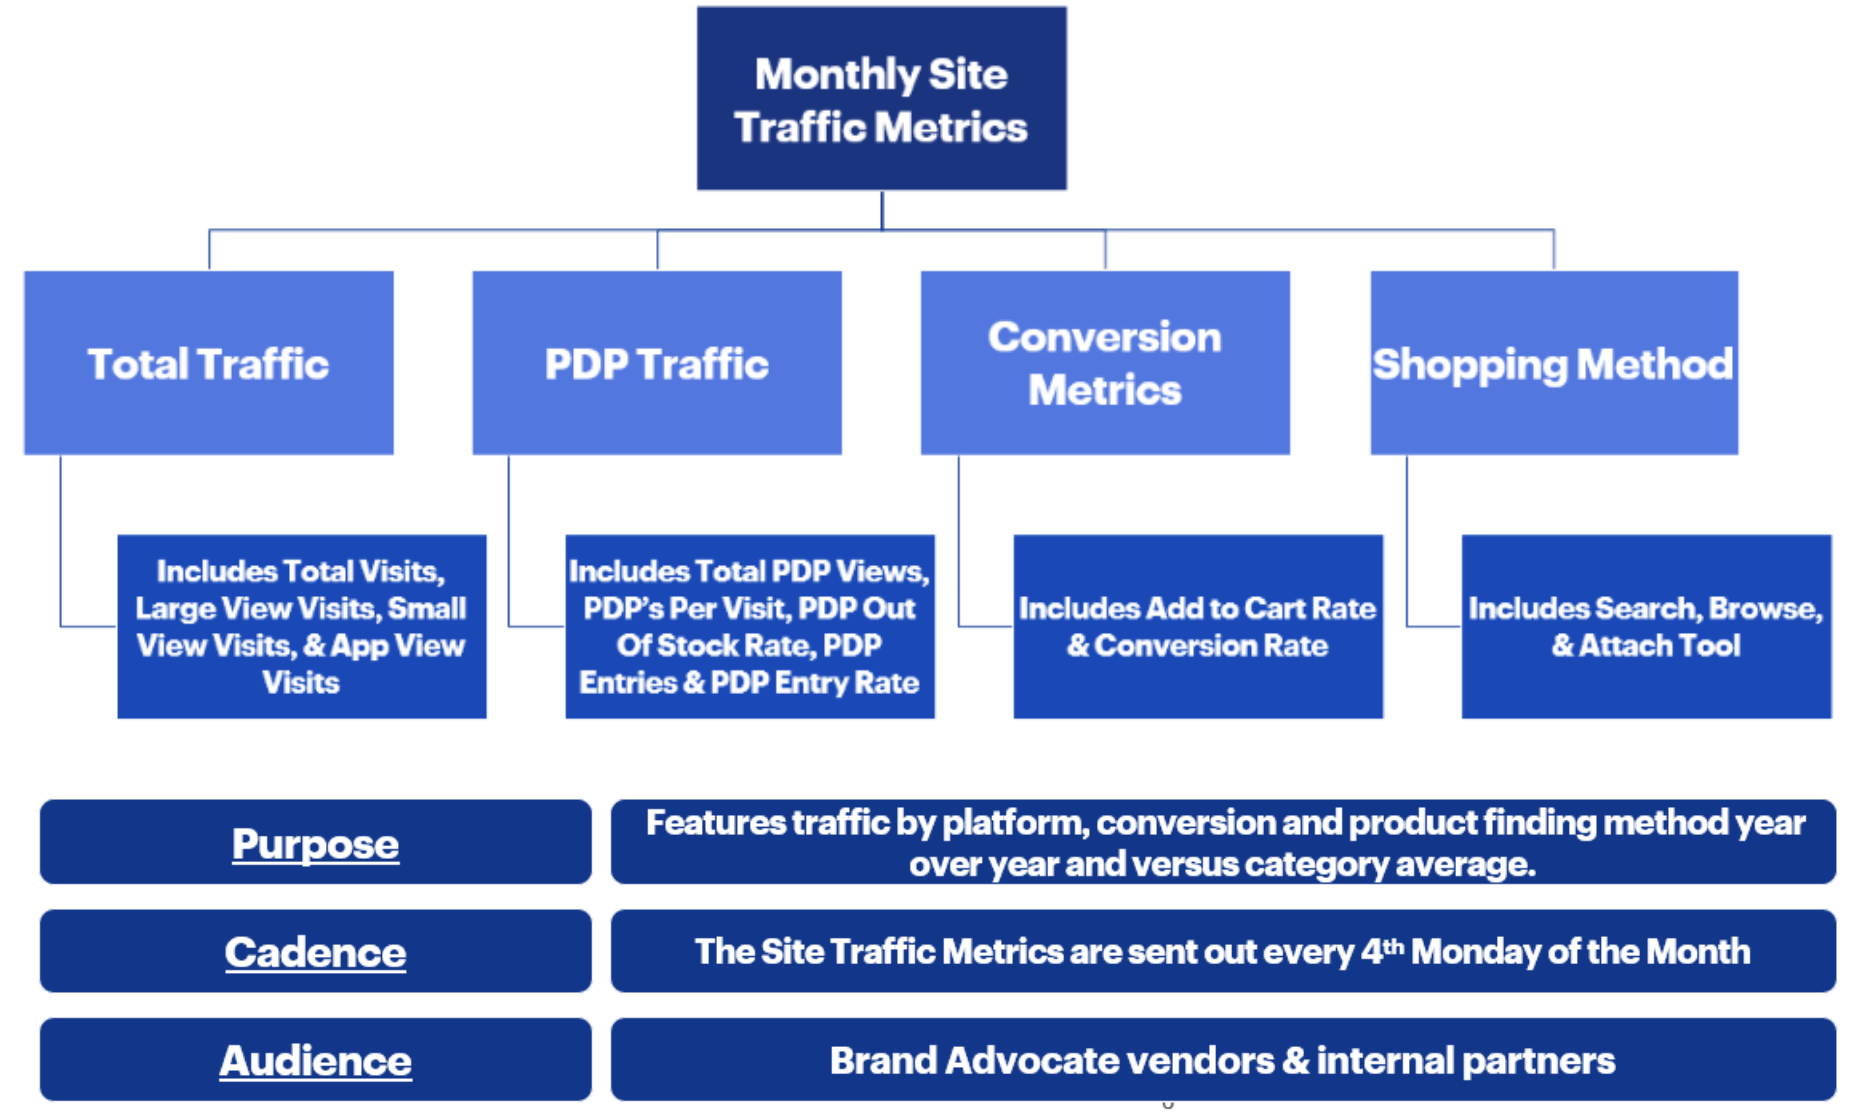
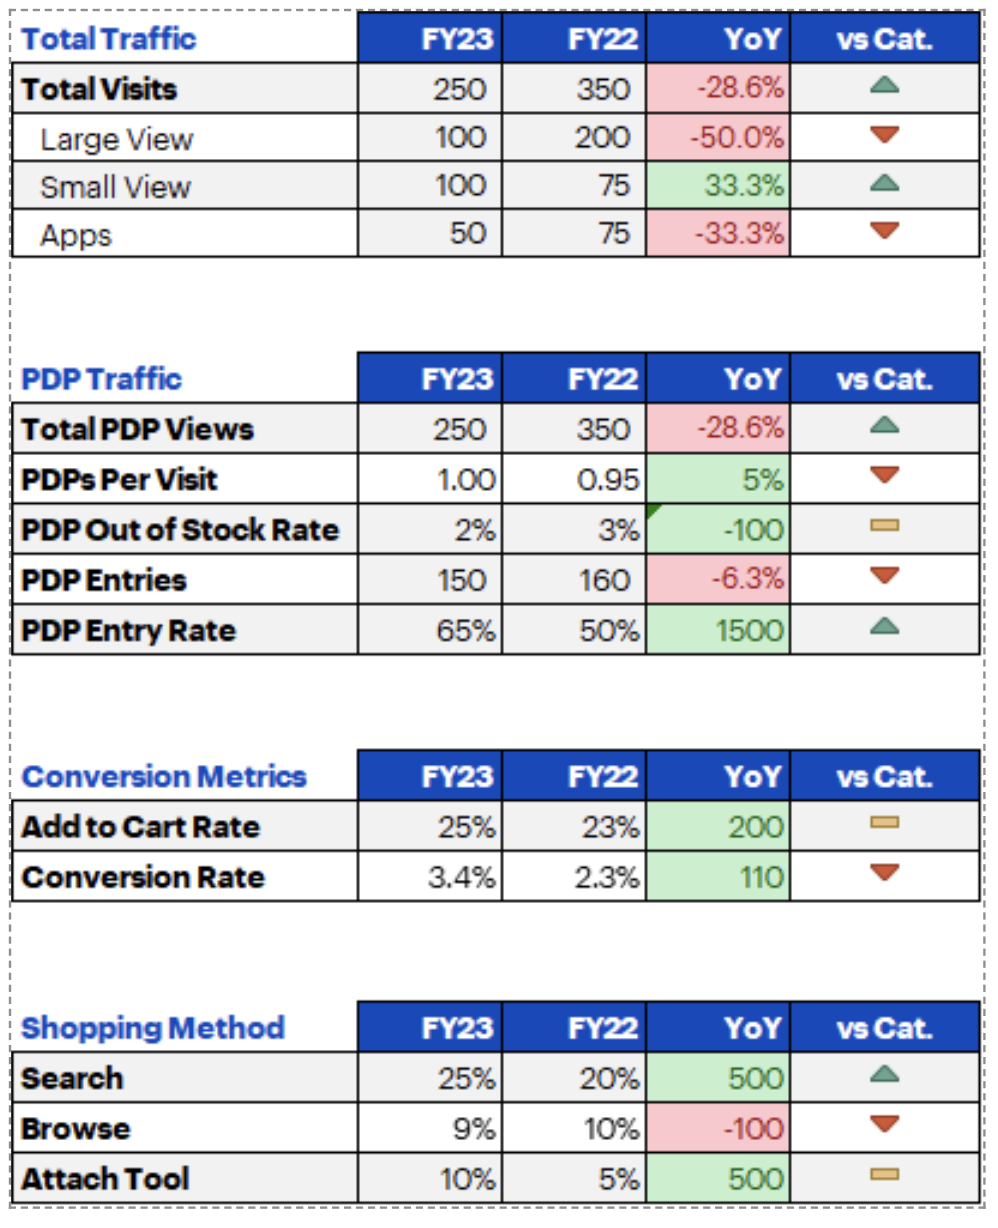
- Identifies which view platform is growing at the fastest rate and how you are growing vs category
- Ex. Improve focus & investment in platform-specific content such as 3D / AR
- Breaks down PDP Traffic YTD and YoY
- Ex. How many eyeballs are getting to your SKUs so far this year compared to the last, and how are you doing against your competitors?
- Cross-reference shopping method with fill rate reporting to identify and prioritize backfill efforts
- Ex. If Search is down YoY, it may be a good opportunity to audit Product Titles, Product Descriptions, and Feature Bullets to include target SEO verbiage
- Update or add CYP to the PDP in order to increase attach tool %
Metric Definitions
| Metric Name | Metric Definitions |
|---|---|
| App to Cart Rate | # of times the Brand's products were added to cart |
| Apps | Visits via the Best Buy App |
| Attach Tool | Product Finding Method using attach tools |
| Browse | Product Finding Method using the site hierarchy, browse listing page |
| Conversion Rate |
Order / Visits. The % of visits that converted into an order. |
| Large View | Visits on computer desktop or laptop in large view |
| PDP Entries | # Visits entered on Product Detail Page |
| PDP Entry Rate | % of Visits entered on Product Detail Page |
| PDP Out of Stock Rate | % of PDP views with the Add to Cart button saying "Sold Out" or "Unavailable" vs # of Total PDP views |
| PDPs Per Visit | Multiple PDPs could be viewed during a visit |
| Search | Product Finding Method using internal search |
| Small View | Visits on mobile device in small view |
| Total PDP Views | Product Detail Pages viewed |
| Total Visits | # of visits where SKU fired at least once. Can occur viewing a PDP, adding to cart, saving for later, compare within a 30-minute session |
Questions? Visit our FAQ page.
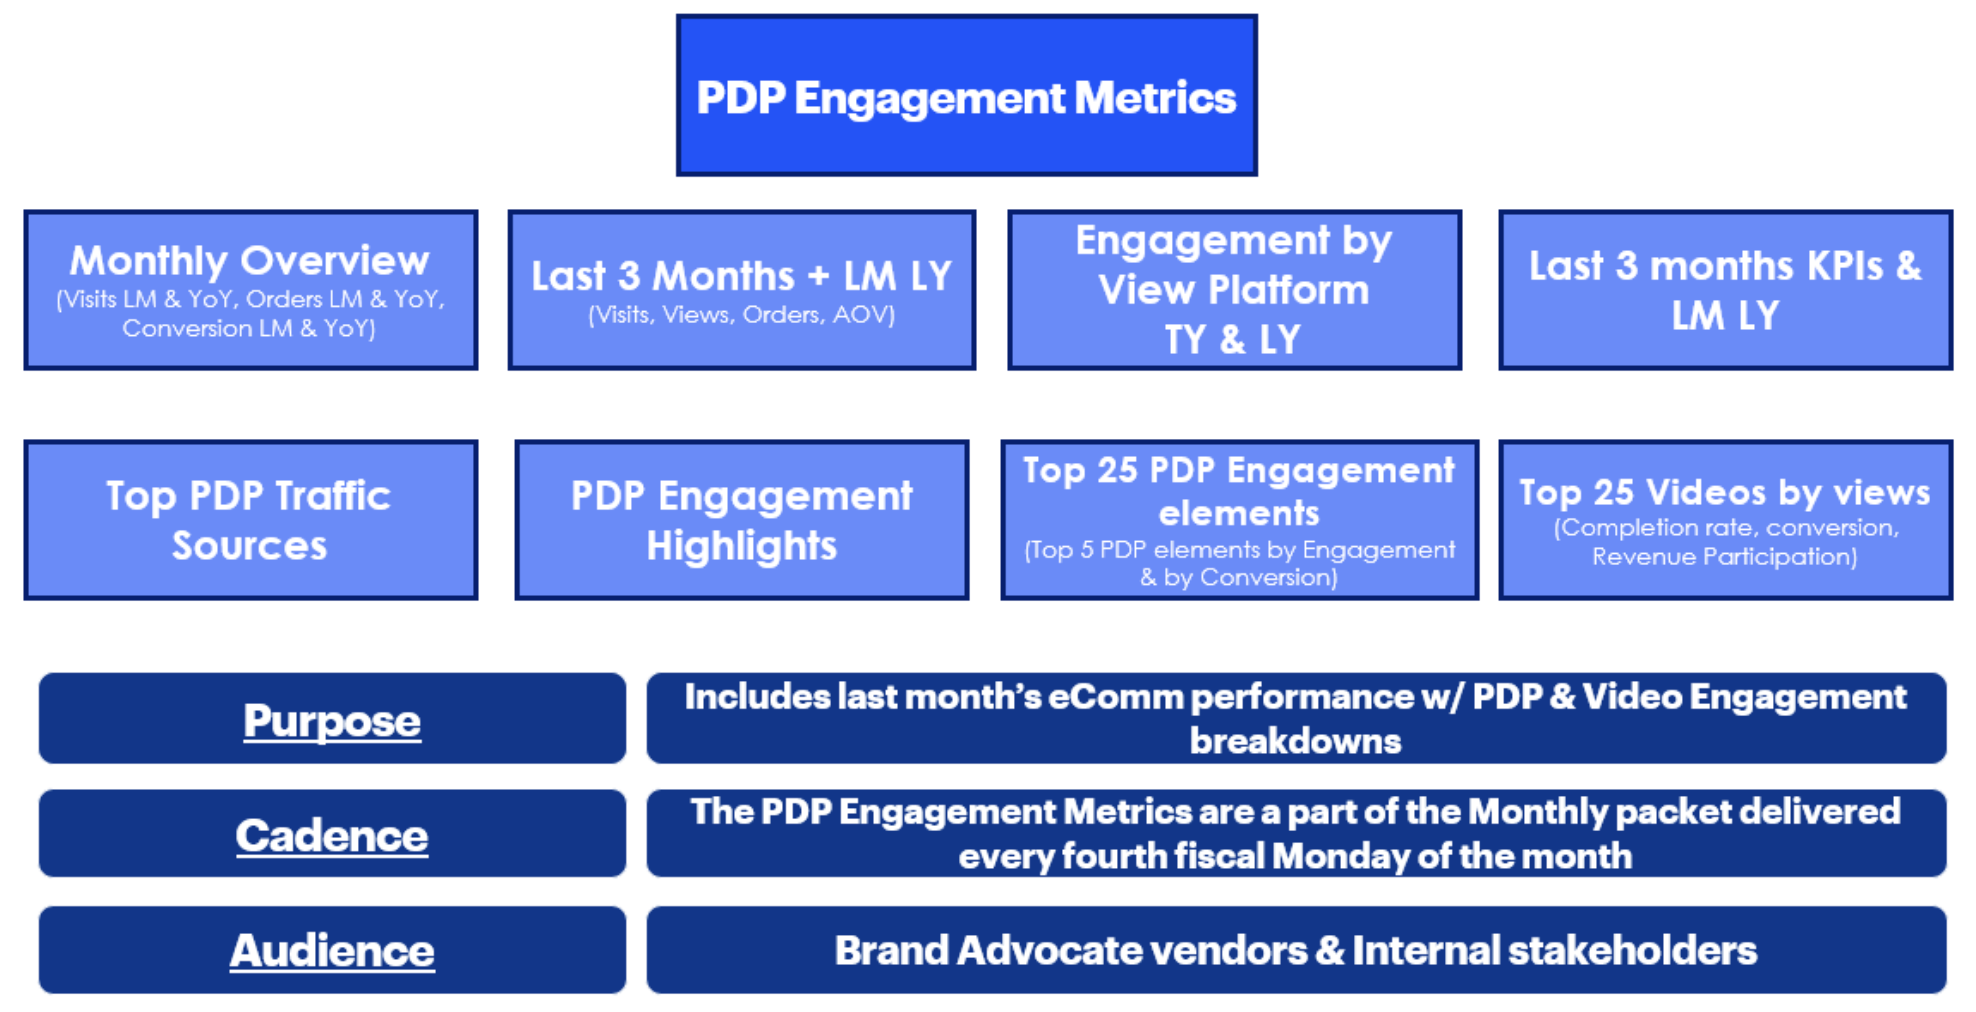
PDP Engagement Metrics [Monthly Reporting]
What's Included?
Guidance
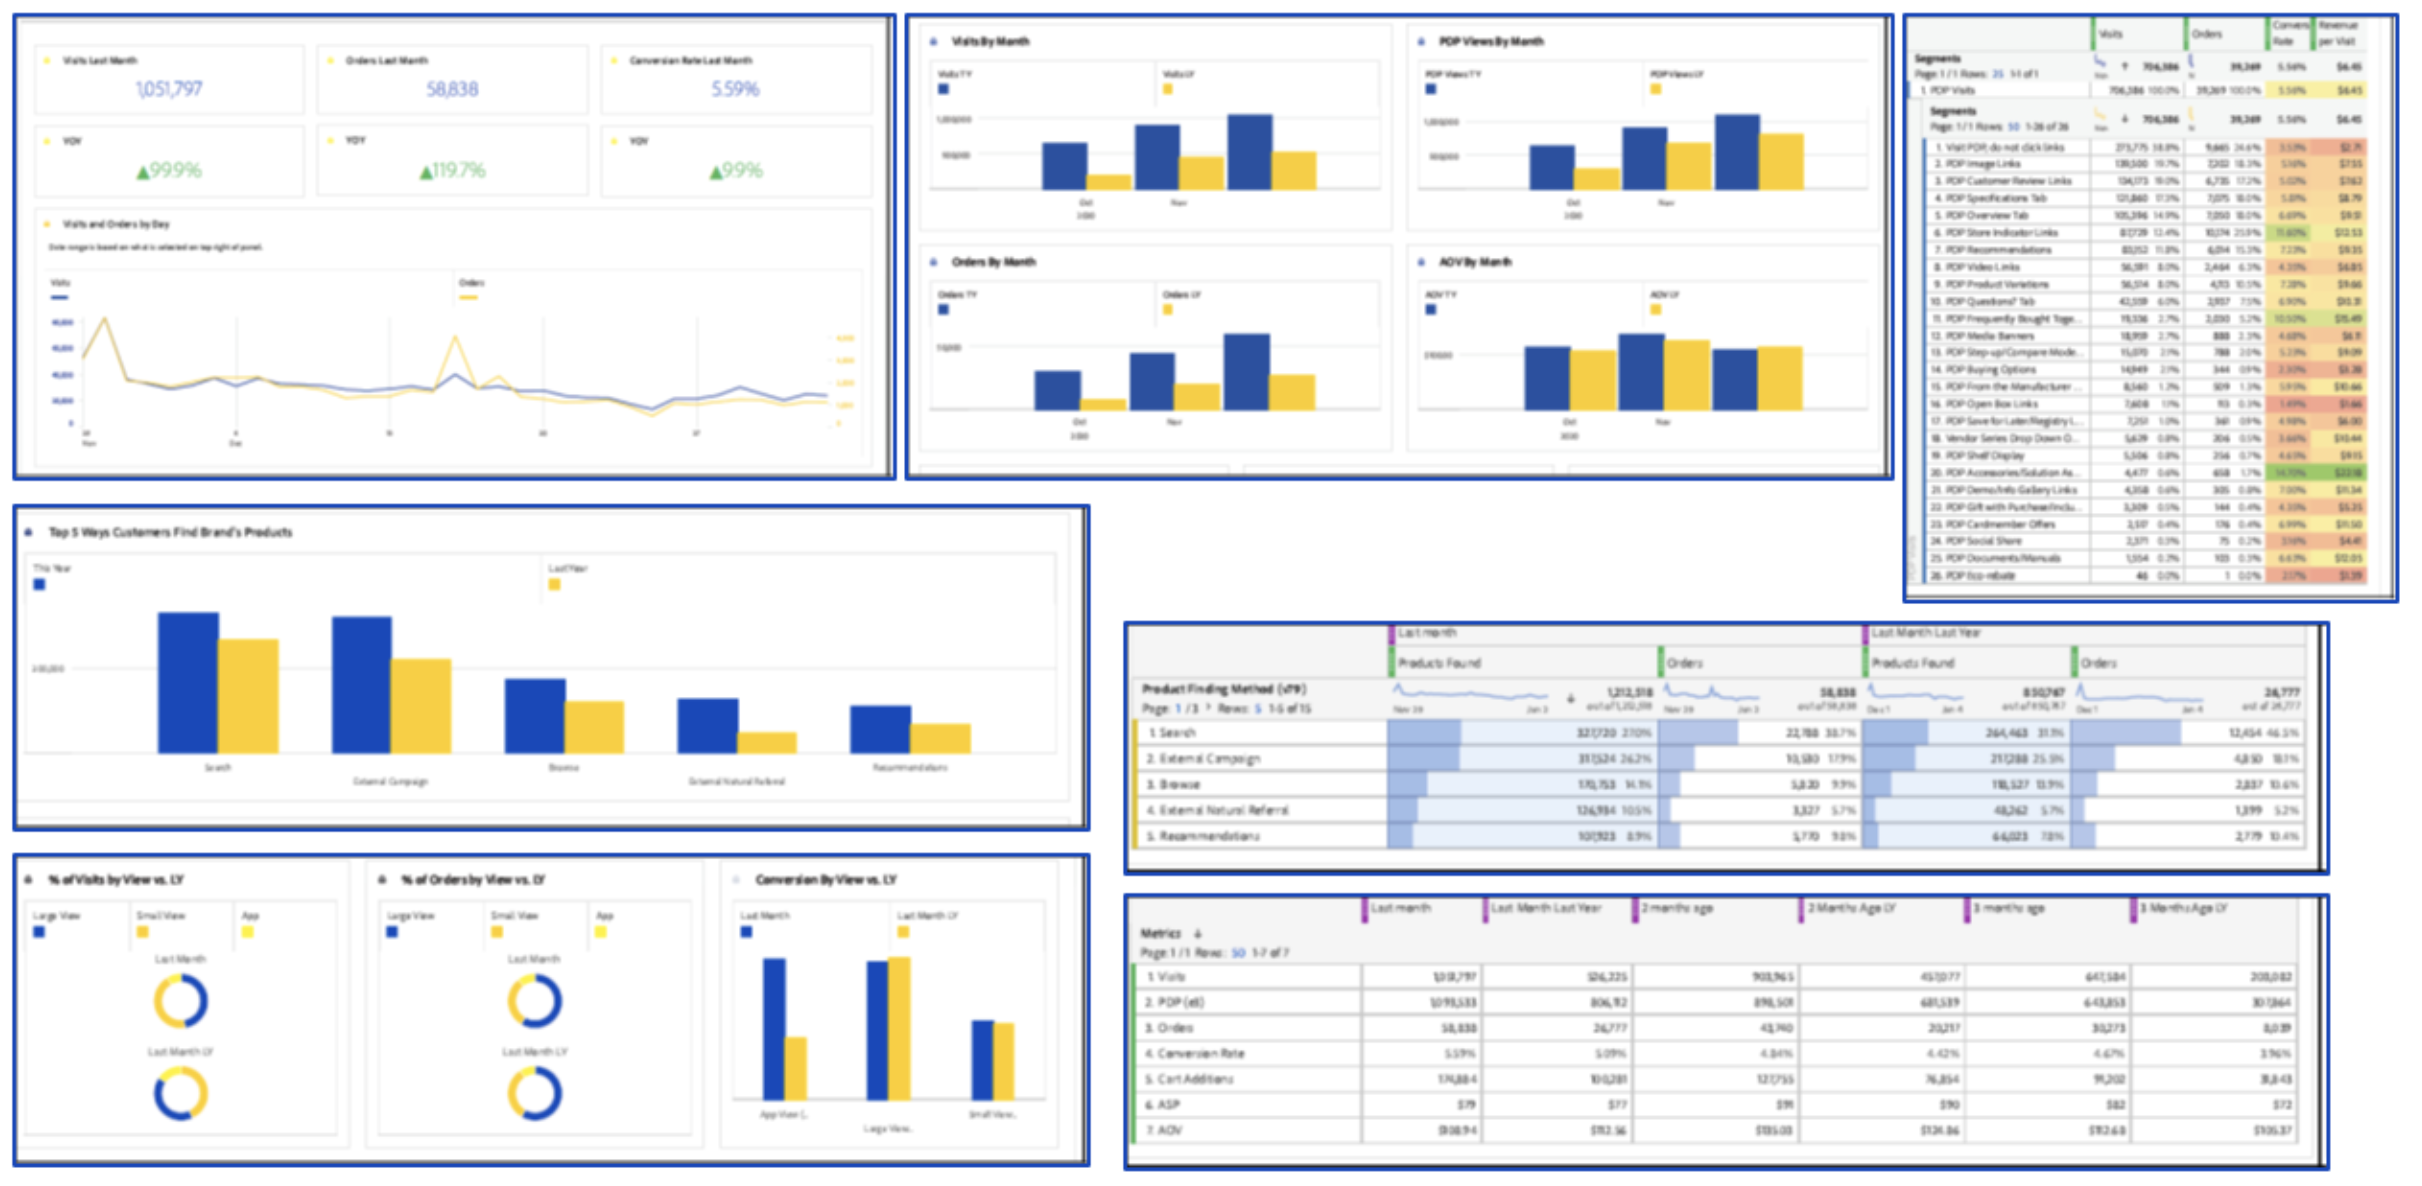
- Visual reference of Visits vs Orders throughout a fiscal month
- Ex. Compare where your peaks & valleys were LM as compared to predicted promotional activity
- Highlights most visited PDP element, helping to prioritize project work.
- Ex. Vendor Series, Videos, Images, CYP, Specifications Tab
- Provides YoY comparison of visits, orders, conversion rate, AOV, and Product Finding Method.
- Ex. Showcases improvements or opportunities for vendor/BA to collaborate on PDP enhancement projects
- Shows engagement & performance by View platform
- Ex. Prioritize digital content based on the view platform (e.g App view vs Large view) that is gaining the most momentum or has the current highest conversion.
Metric Definitions
| Metric Name | Metric Definitions |
|---|---|
| AOV (Average Order Value) | Revenue / Orders. AOV is only calculated within a single Class so AOVs may be very close to ASPs. |
| App View | Visits via the Best Buy App |
| ASP (Average Selling Price) | Revenue / Units |
| Attach | Product Finding Method using attach tools |
| Browse | Using the site hierarchy, browse listing page |
| Cart Additions | # of times Brand's products were added to cart |
| Conversion Rate | Order / Visits. The % of visits that converted into an order. |
| External Campaign | Coming from an external source with a ref/loc |
| Internal Campaign | Internal promotion pages |
| Large View | Visits on computer desktop or laptop in large view |
| Orders | # of orders containing brand's products |
| PDP Views | # of brand's PDPs viewed |
| Revenue Participation | Total Marketed Demand dollar amount sold before returns and cancelations |
| Search | Product Finding Method using internal search |
| Small View | Visits on mobile device in small view |
| Video 50% Completion | % of customers who reached the halfway point of the video |
| Video Completion Rate | % of customers who completed watching the video |
| Video Start | # of customers who started a video |
| Visits | # of visits where SKU fired at least once. Can occur viewing a PDP, adding to cart, saving for later, compare within a 30-minute session |
Questions? Visit our FAQ page.
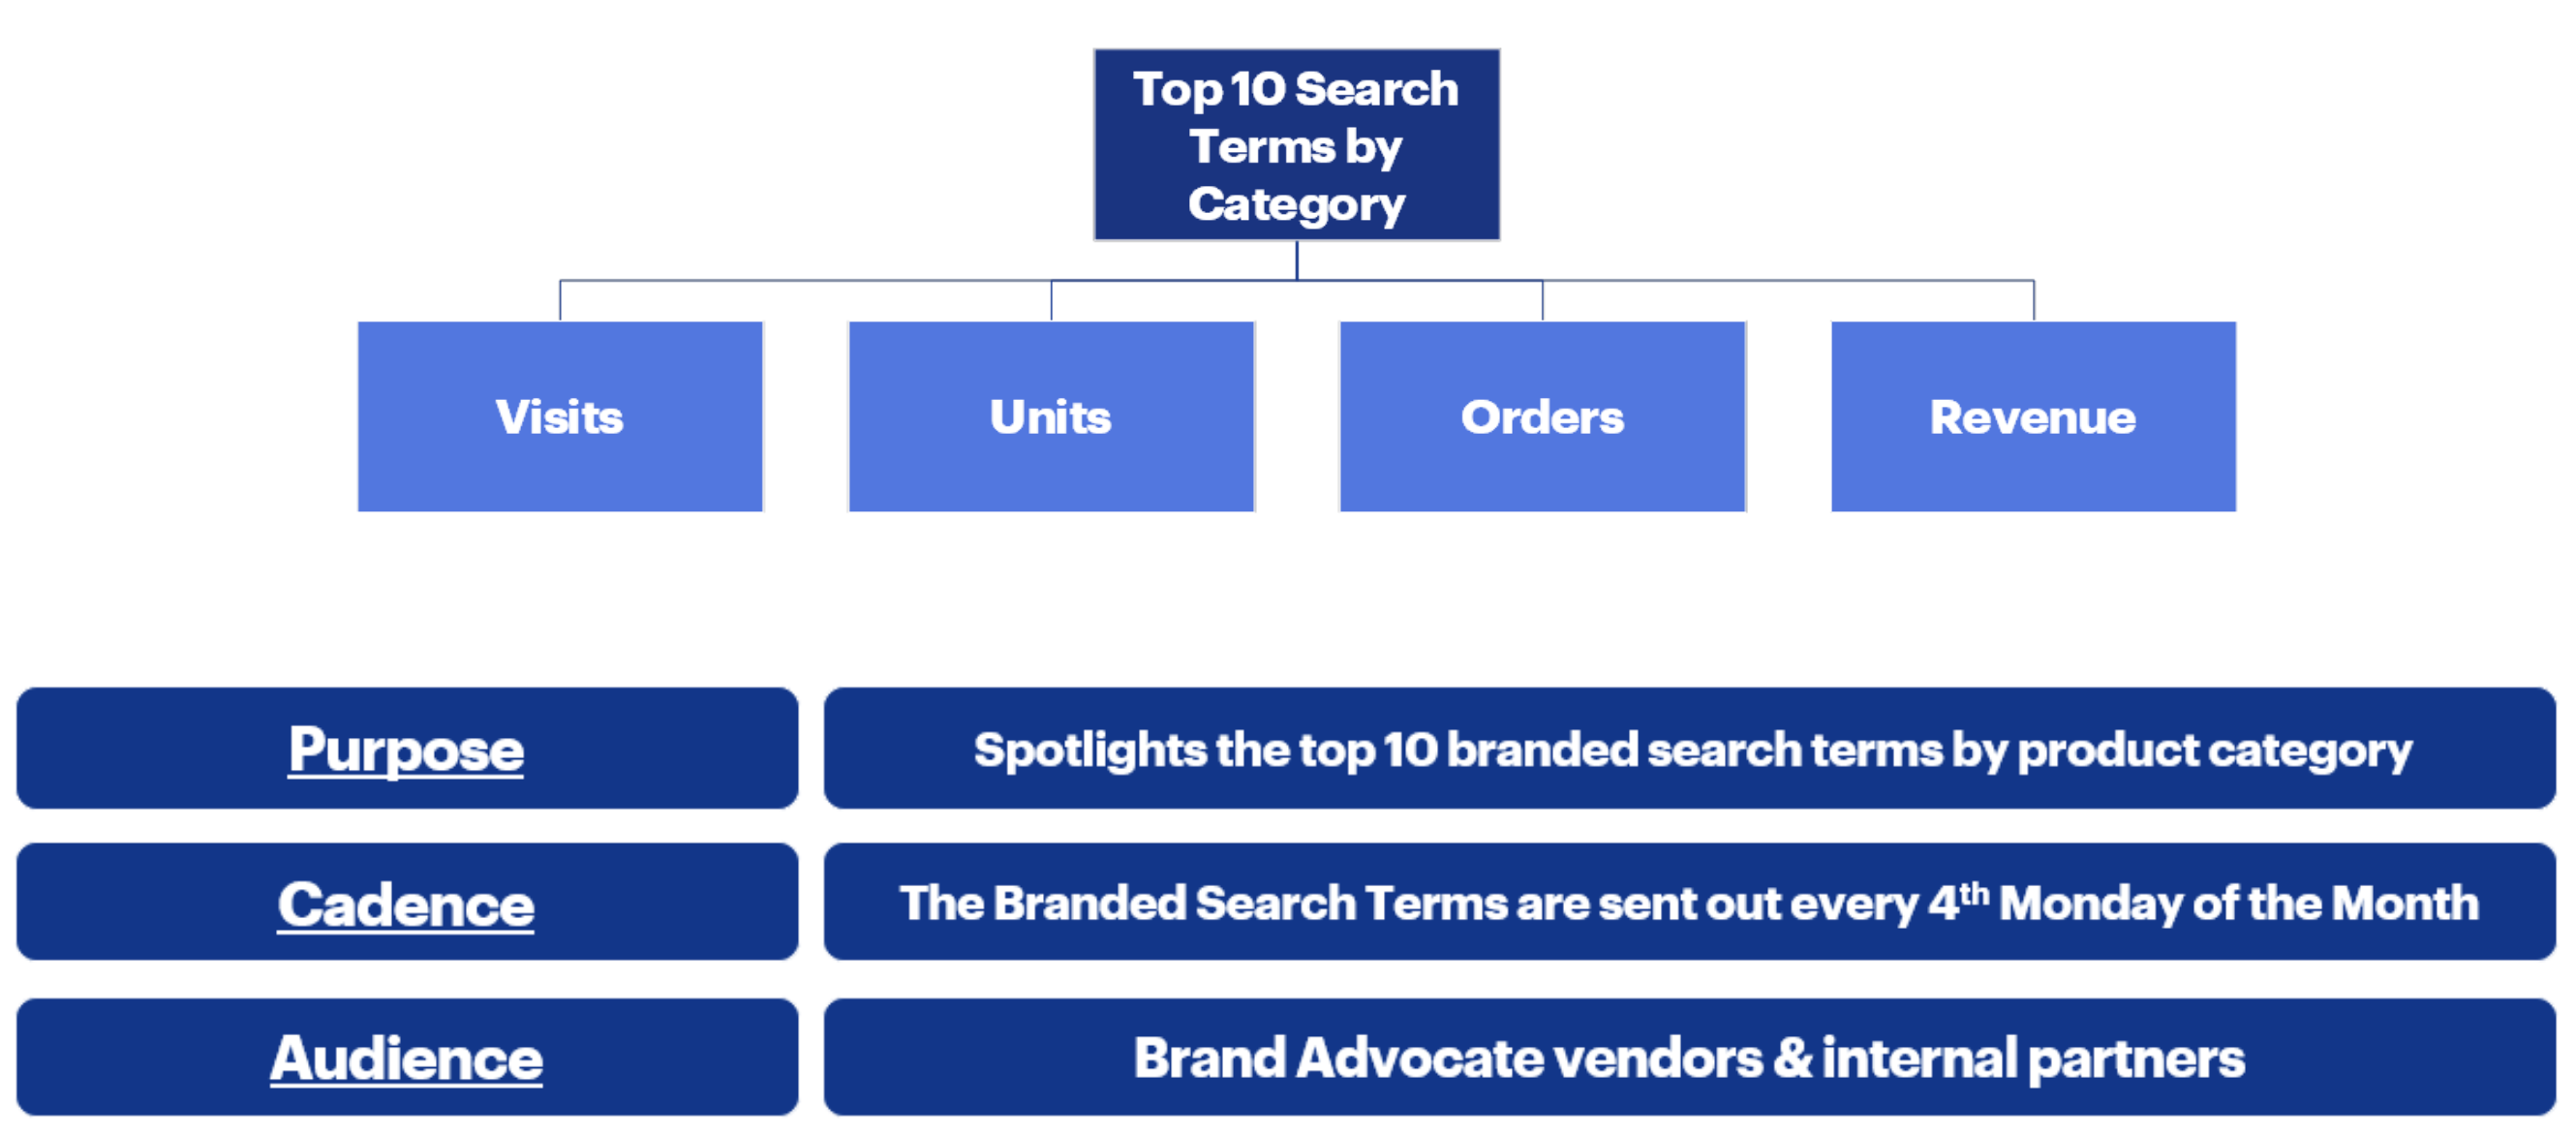
Branded Search Terms [Monthly Reporting]
What's Included?
Guidance
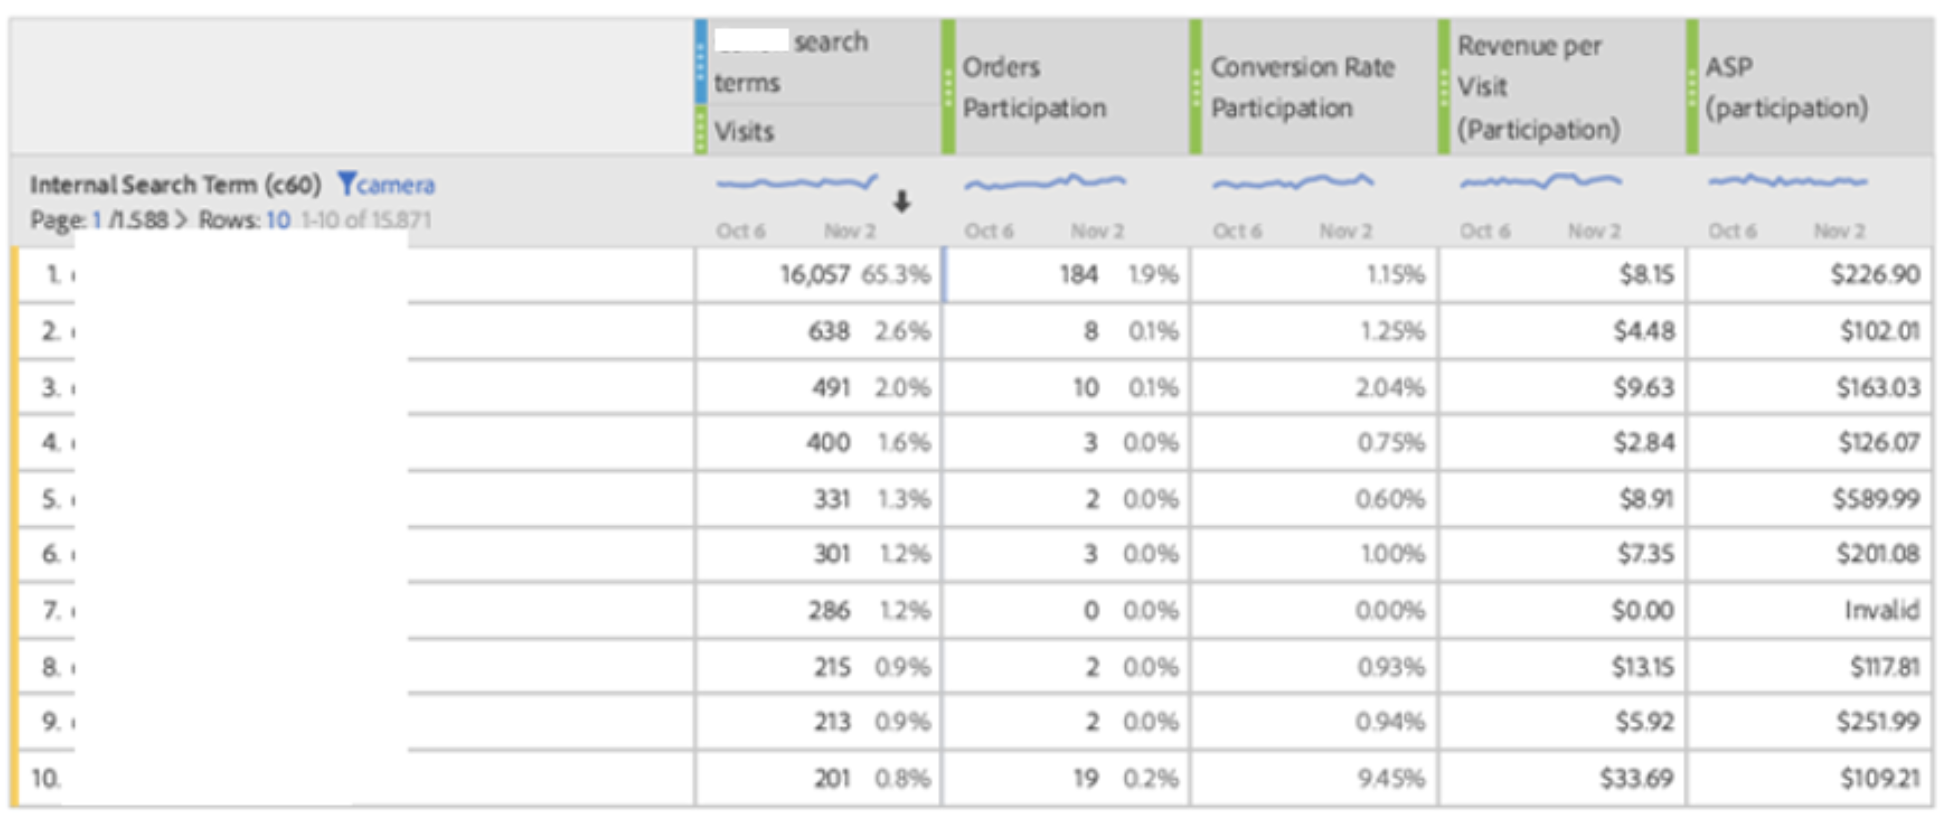
- Audit PDP to ensure search terms are included in areas that impact search results
- Ex. Title, First 5 Feature Bullets, Description
- Provides insight into product features customers are interested in
Metric Definitions
| Metric Name | Metric Definitions |
|---|---|
| Orders | # of orders containing at least one unit of the SKU. Completed transaction. Note: One order can contain multiple units. |
| Revenue | Total Marketed Demand dollar amount sold before returns and cancelations |
| Units | # of units that were fulfilled |
| Visits | # of visits where SKU fired at least once. Can occur viewing a PDP, adding to cart, saving for later, compare within a 30-minute session |
Questions? Visit our FAQ page.
Reports: FAQs
Frequently Asked Questions (FAQs)
Who do I engage with for specific reporting questions?
Content Related? -> Brand Advocate
Business Performance? -> Business Team (Category Lead, E-Comm Analyst, Demand Planning Analyst, Merchant Analyst)
Ex. Content Related: Metric definition questions, SKU level content health
Ex. Business Performance: Comparative Analysis vs last year, promotional activity/performance
If I see an inconsistency in the data, how do I validate its accuracy?
Brand Advocate can initiate the ticket process to validate source data.
Can we get a comparative analysis & business context?
Because we are vendor funded and focused on supporting your brand, please reach out to your business team (Category Lead, E-Comm Analyst, Demand Planning Analyst, Merchant Analyst) who is better equipped to provide comparative analysis.)
What is the difference between visits and PDP views?
# of visits - where SKU is fired at least once. Can occur viewing a PDP, adding to cart, saving for later, compare tool PDP views - # of PDPs viewed for SKU
What's the difference between total spec fill rate, key spec fill rate, and required spec fill rate?
The Fill Rate report calculates the number of attributes filled in over the total number of attributes available to be filled in and gives you a percentage. Total Spec Fill Rate includes all available attributes across your total brand. Key Spec Fill Rate includes only the attributes deemed to be Key Specs for your categories. Required Spec Fill rate includes only the Specs that are deemed Required to fill in for that item to be launched on site.
Why are our return rates >100%?
There were more order returns this reporting week than there were orders fulfilled. This can be driven by promotional activity.
Why am I not seeing a new SKU on the report?
Newly launched SKUs may not appear on the Weekly SKU reports for the first week or two after launch due to the timing of when they are classified by DIO.
How long does it take for SKUs to fall off the report after leaving the site?
Since historical data may be linked to SKUs, they will pull through on reporting as long as they have activity in any measured metric.
What is the # of Returned Units WOW/MOM and how is it affecting total revenue?
Return % that is reporting is # of units returned over units fulfilled within the same time period. MD$ Revenue is calculated before returns cancellations.
When will YoY data be available?
There is not an estimated delivery available at this time; however, it is anticipated that it could range from weeks to months.
What reports will be affected by these changes?
All Brand Advocate reports (weekly, monthly, ad-hoc) have been affected by these changes. The changes will be detailed in the appropriate report.
Are there any metrics that have changed?
Yes. The data collection variables and processing capabilities will drive changes in the metrics. For example, traffic will appear about 2% higher. Details around changes to metrics will be included in the appropriate report.
Why are Sessions/Orders for PDP Engagement different than overall Sessions/Orders in my DIOR Dashboard?
There is a lot of web traffic to pages that are automated (robots), but there is also human interaction where they do not interact with the portions of the PDP and click off – this is typically stemming from external sources. The PDP Engagement Session/Order numbers have a filter applied already that removes visitors (robots and humans) who do NOT interact with a portion of the PDP. So this number is showing the number of users who interacted with/ordered from your brand's PDP somewhere along their shopping journey.
For overall Sessions/Orders, these numbers do not have the filter mentioned above which excludes no engagement and simply counts the number of orders and sessions regardless of interactions.
- On this page:
- Reporting Menu
- SKU Performance Report [Weekly & Monthly Reporting]
- Brand Advocate KPIs [Monthly Reporting]
- Content Health Metrics [Monthly Reporting]
- Site Traffic Metrics [Monthly Reporting]
- PDP Engagement Metrics [Monthly Reporting]
- Branded Search Terms [Monthly Reporting]
- Reports: FAQs

